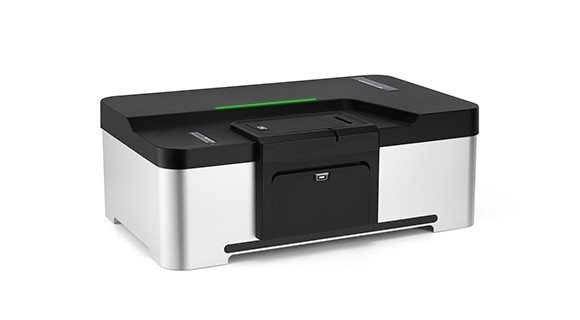
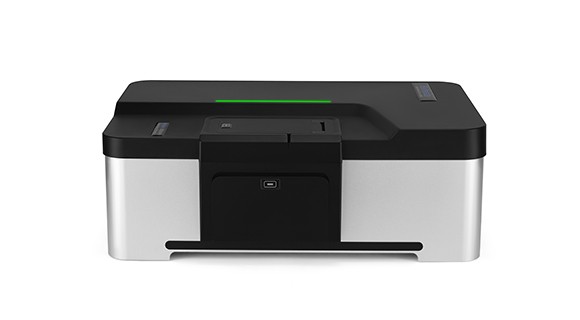
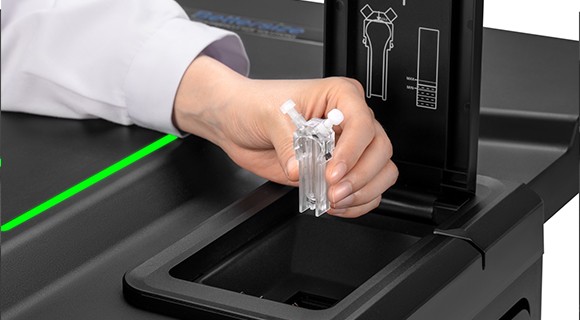
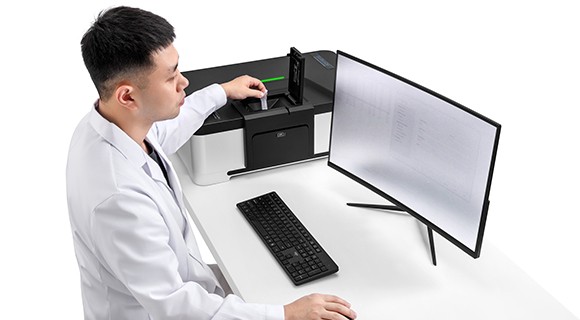
BeNano 180 Zeta Pro Nanoparticle Size and Zeta Potential Analyzer
- Product Item : BeNano
- Category: Particle Size and Shape Analyzer
- Brand: Bettersizer
- Model: BeNano 180 Zeta Pro
- Package : Wooden Box
- Product description:The BeNano Series is the latest generation of nanoparticle size and zeta potential analyzers designed by Bettersize Instruments. Dynamic light scattering (DLS), electrophoretic light scattering (ELS),
The BeNano Series is the latest generation of nanoparticle size and zeta potential analyzers designed by Bettersize Instruments. Dynamic light scattering (DLS), electrophoretic light scattering (ELS), and static light scattering (SLS) are integrated into the system to provide accurate measurements of particle size, zeta potential, and molecular weight. The BeNano Series is widely applied in academic and manufacturing processes of various fields including but not limited to: chemical engineering, pharmaceuticals, food and beverage, inks and pigments, and life science, etc.
Features and Benefits
- ● Size range: 0.3nm - 15μm
- ● Minimum sample volume 3μL
- ● APD (Avalanche Photodiode) detector providing exceptional sensitivity
- ● Automatic adjustment of laser intensity
- ● Intelligent algorithm of result evaluation
- ● DLS backscattering (173°) detection technology
- ● User-adjustable scattering volume for concentrated samples
- ● PALS (Phase Analysis Light Scattering) technology
- ● Programmable temperature control system
- ● Compliance with 21 CFR Part 11, ISO 22412, ISO 13099
Features:
1) Optical System of the BeNano 180 Zeta Pro
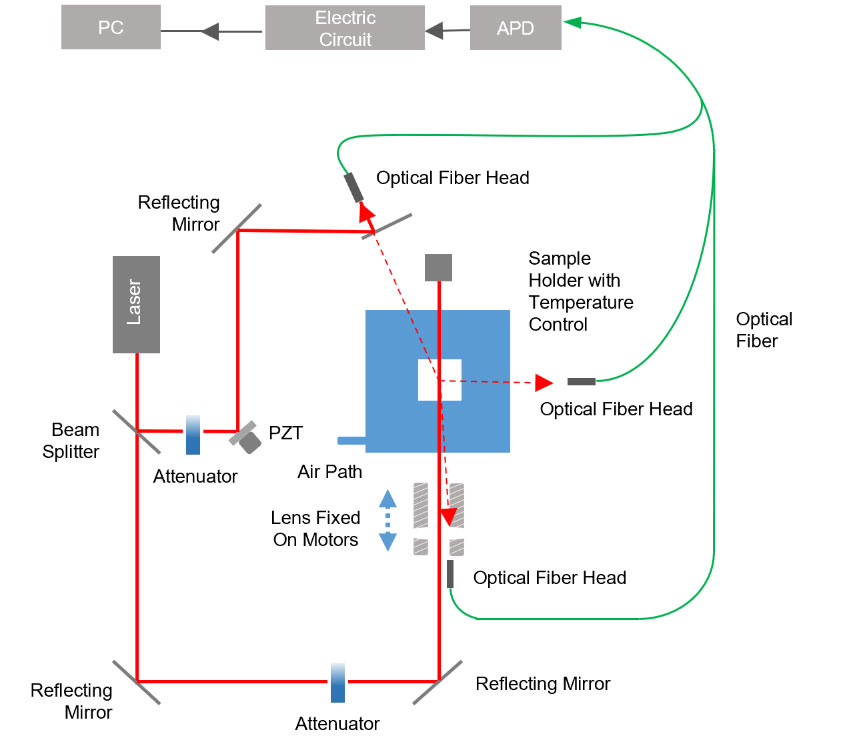
2) Dynamic Light Scattering
Dynamic light scattering (DLS), also known as photon correlation spectroscopy (PCS) or quasi-elastic light scattering (QELS), is a technology used to detect the fluctuations of the scattering intensities caused by the Brownian motion of particles.
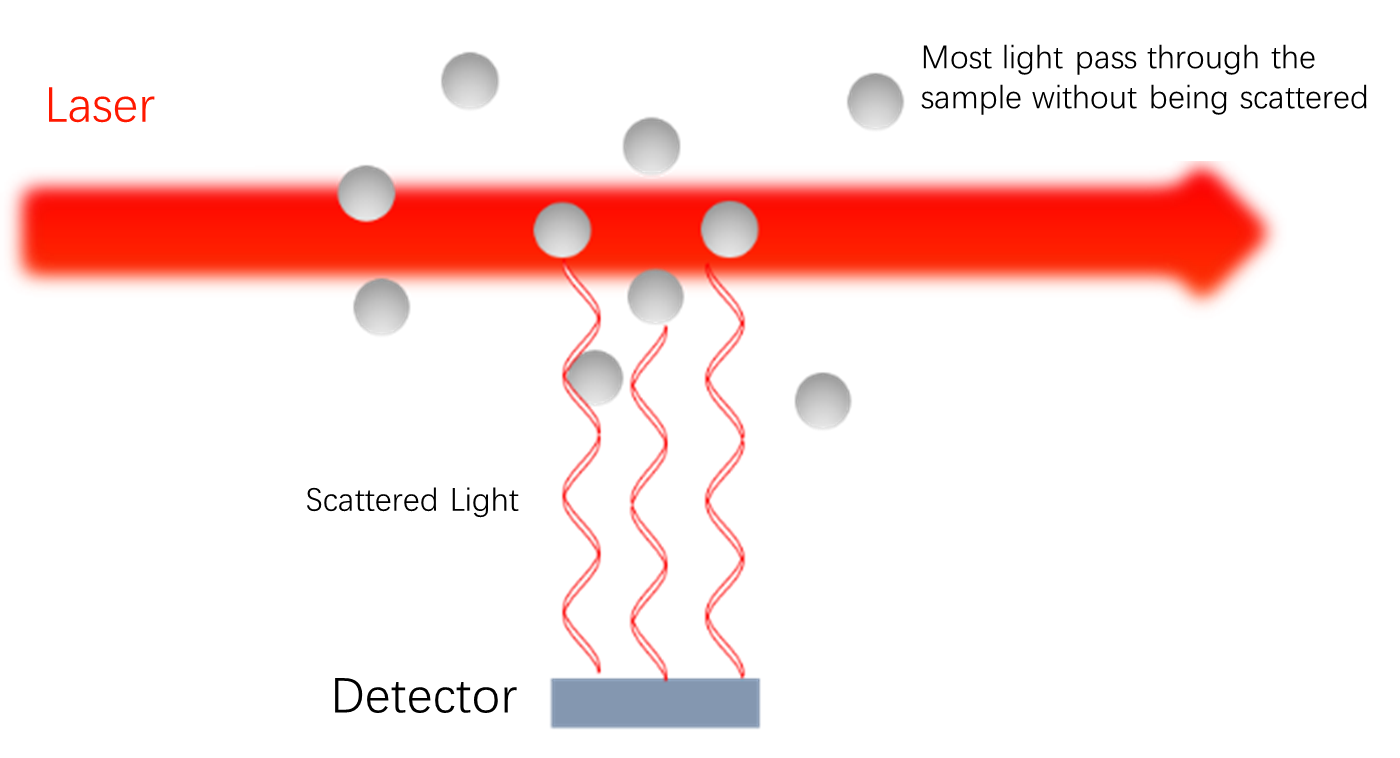
In the dispersant, smaller particles move faster, while larger particles move slower. An avalanche photodiode (APD) detector aligned at 90° or 173° collects the scattering intensities of the particles and records them with time. The time-dependent fluctuation is converted into a correlation function using the correlator. By applying a mathematic algorithm, the diffusion coefficient D is thereby obtained. The hydrodynamic diameter DH and its distribution are calculated through the Stokes-Einstein equation.

3) Electrophoretic Light Scattering
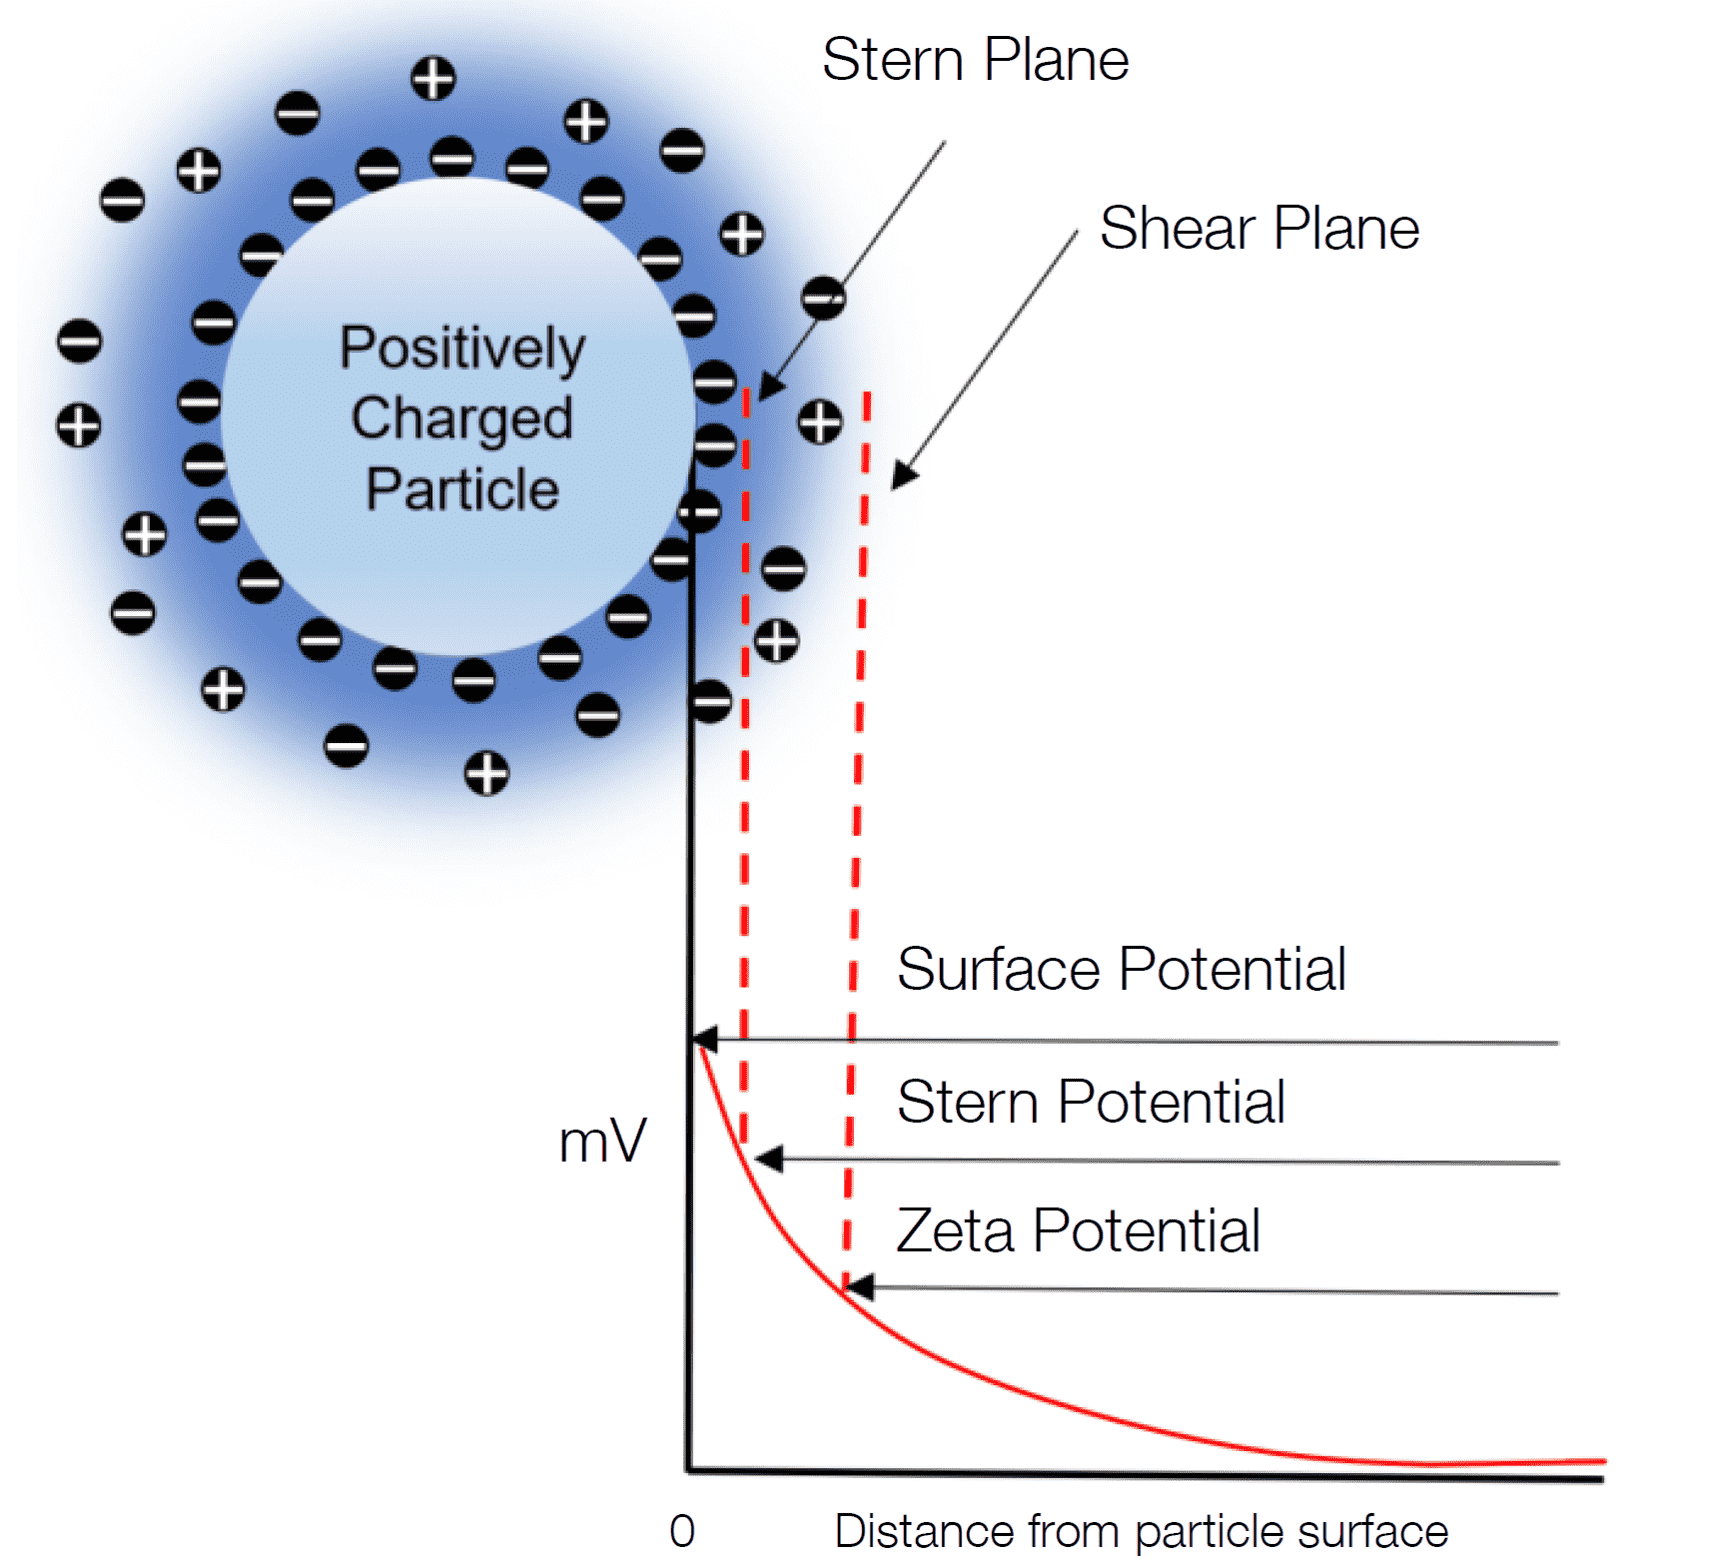
Particles usually carry charges on the surface in aqueous systems, surrounded by counter-ions that form a firmly inner Stern layer and an outer shear layer. Zeta potential is the electrical potential at the interface of the shear layer. Suspension systems with higher zeta potentials tend to be more stable and less likely to form aggregates.
Electrophoretic light scattering (ELS) is a technology for measuring electrophoretic mobility via Doppler shifts of the scattered light. When an incident light illuminates dispersed particles that are subjected to an applied electric field, the frequency of the particles' scattered light will be different from the incident light due to the Doppler effect. The frequency shift is measured and converted to provide the electrophoretic mobility and hence the zeta potential of a sample by Henry's equation.


4) Static Light Scattering
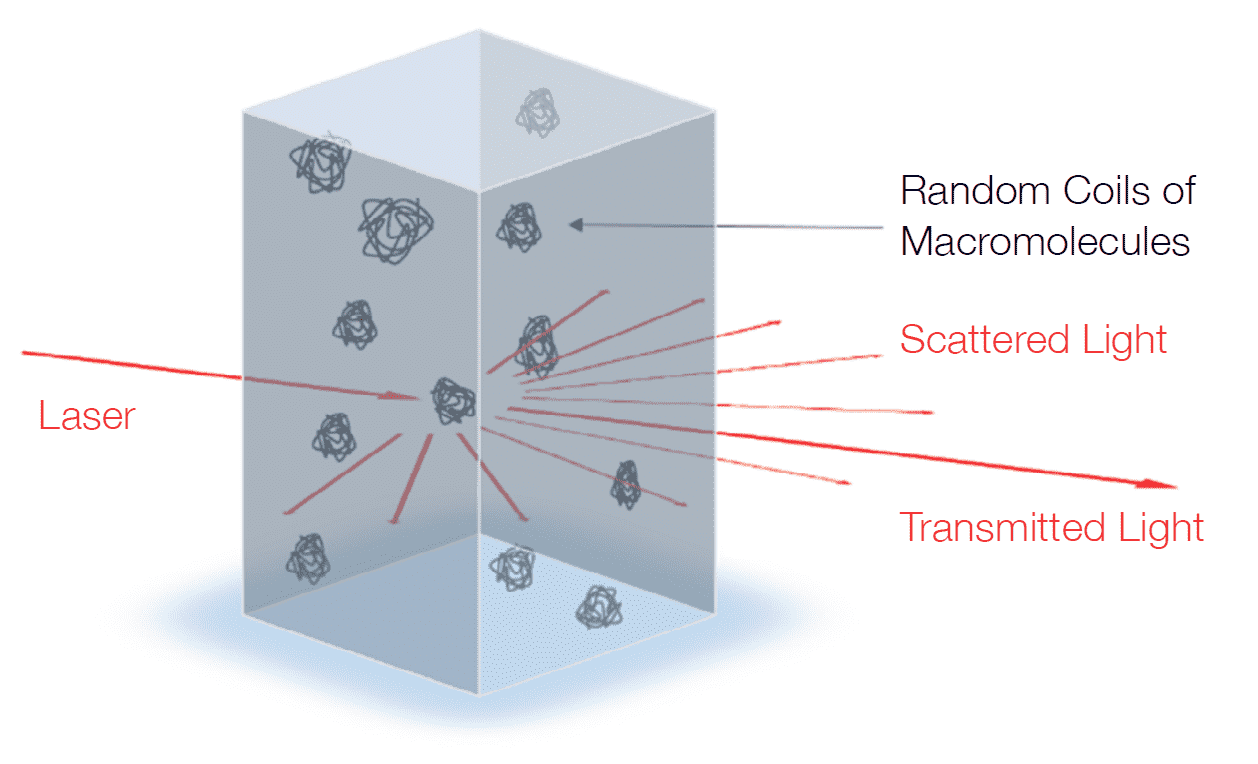
Static light scattering (SLS) is a technology that measures the scattering intensities of the sample, weight-average molecular weight (Mw), and second virial coefficient A2 through the Rayleigh equation:

where c is the sample concentration, θ is the detection angle, Rθ is the Rayleigh ratio used to characterize the intensity ratio between the scattered light and the incident light at angle θ, Mw is the sample’s weight-average molecular weight, A2 is the second virial coefficient, and K is a constant related to (dn/dc)2.
During molecular weight measurements, scattering intensities of the sample at different concentrations are detected. By using the scattering intensity and Rayleigh ratio of a known standard (such as toluene), the Rayleigh ratios of samples at different concentrations are computed and plotted into a Debye plot. The molecular weight and the second virial coefficient are then obtained through the intercept and slope from the linear regression of the Debye plot.

5)Backscattering Detection Technology
- Higher detection sensitivity for samples with very low concentrations down to 0.1 ppm.
- Intelligent search for the optimal detection position, which greatly avoids the multiple scattering effect of samples and can detect samples with concentrations of up to 40%.
- Effectively limiting the interference of dust.
 When the sample is detected at 173° in the middle of the cell, the scattered volume is 8-10 times larger than at 90°, leading to much higher sensitivity, and avoiding reflections from the sample cell wall.
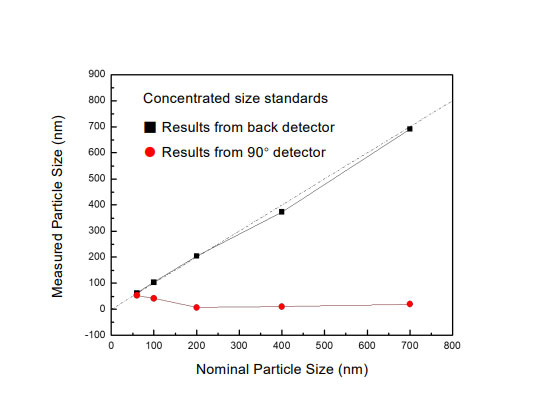 When measuring concentrated size standards, the results obtained from the 173° detector are in much better agreement with the nominal values, compared with the results from the 90° detector.
6)Phase Analysis Light Scattering (PALS)
The traditional ELS converts the correlated scattering signals into frequency distribution and then calculates the frequency shift Δf of the scattered light, compared with the reference light. Phase analysis light scattering (PALS), an advanced technology based on the traditional ELS technology, has been further developed by Bettersize Instruments Ltd. to measure zeta potential and its distribution of a sample. By analyzing the phase information Φ of the original scattered signal, PALS obtains the frequency information of that light. The phase shift with time dΦ/dt is proportional to the frequency shift Δf. PALS technology can suppress the influence of the Brownian motion of particles on the results, thereby providing higher statistical accuracy. In various applications, PALS can effectively measure the zeta potential of particles whose charge approaches the isoelectric point, for instance, particles with very slow electrophoretic mobility at a high salt concentration.


7) Temperature Trend Measurement
Temperature trend measurement includes:
- Size vs. Temperature
- Zeta Potential vs. Temperature
Investigating the particle size and zeta potential of the samples under different temperatures is significant in many applications. The function of Programmed Temperature Change, ranging from -10°C to 110°C, makes Temperature Trend Measurement available in the BeNano Series.

Benefits
- This feature benefits users who need to study the stability of protein formulations. Generally, the higher the denaturation temperature of the protein, the more stable the formulation.
- Besides, it is useful for users who need to simulate real-time aging using elevated temperatures to manually speed up the aging process.
8) Viscosity Measurement
For the sample of unknown viscosity, the viscosity measurement could be implemented using tracer particles with known sizes (e.g., standard samples with nominal sizes). When the measurement ends, input the accurate size of the tracer particles, and the viscosity of the sample could be determined.
After the measurement, choose and right-click on the corresponding result. Click "Viscosity Calculator" on the pop-up menu.

By inputting the nominal values of the tracer particles and clicking on "Calculation", the viscosity of the sample could be finally ascertained.
CATEGORIES
- Textile Testing Equipment
- Paint,Coating&Ink
- Paper, Packaging & Print
- Plastic tester machine
- Whiteness Meter
- Environmental Test Chamber
- Color and Gloss meter
- Color Assessment Cabinet
- Metal Testing Instrument
- Particle Size and Shape Analyzer
- Coating Thickness Gauge
- Electronic Balance
- Tensile Testing Machine
- Density Meter
- Color Fan Deck
- UV Spectrophotometer & Spectrometer
- Other
LATEST NEWS
Contact
CONTACT USName: Jennifer Zhang
Mobile:+86 13336040868
Tel:+86 13336040868
Whatsapp:+86 13336040868
Email:sales@iqctest.com
Add:No.51 of Xiba Road,Wuchang Street, Yuhang District, 311100 ,Hangzhou City, China
